

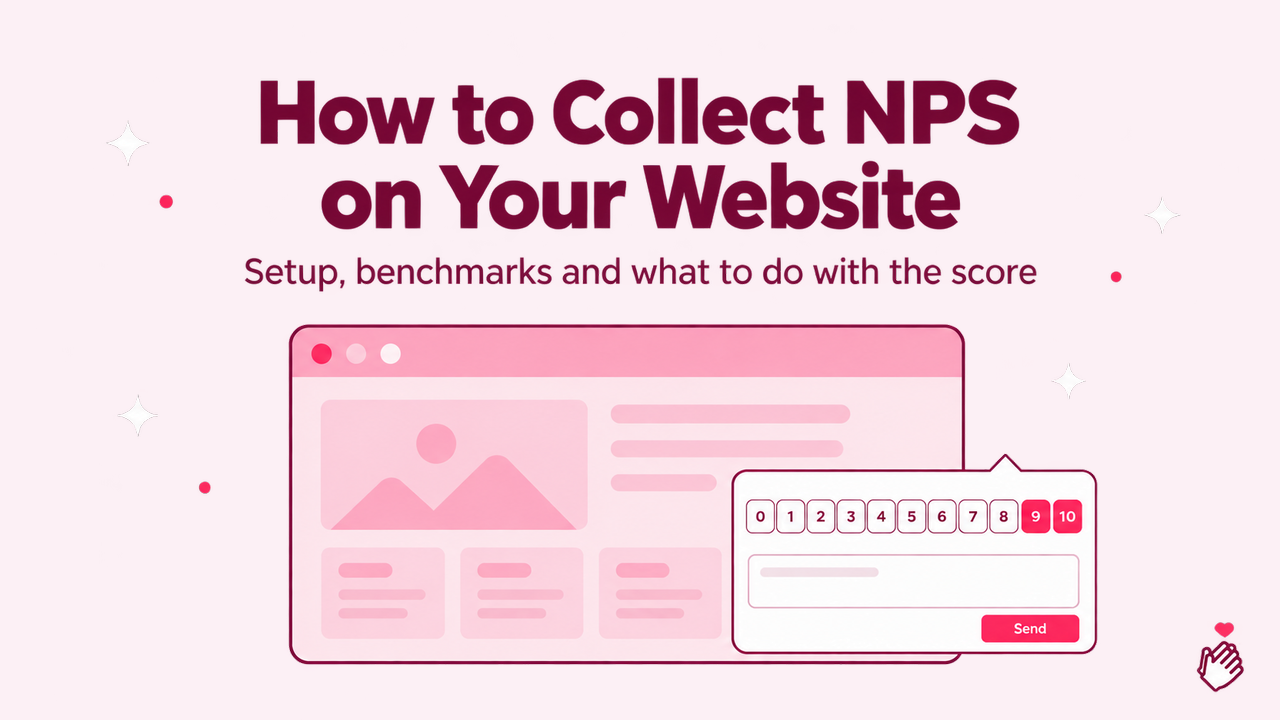
Net Promoter Score is one question: how likely are you to recommend us to a friend or colleague, from 0 to 10. Fred Reichheld introduced it in the December 2003 issue of Harvard Business Review, in an article called The One Number You Need to Grow, after Bain and Satmetrix had tested a range of survey questions against actual purchase and referral behaviour. The recommendation question predicted growth better than the others, so it stuck.
Twenty years on, most companies still ask it by email, weeks after the fact, and most customers ignore it. The alternative is asking it on your website, and the rest of this piece is about that: how to set it up, what a normal score looks like, and what to do with the answers so the number is not the only thing you get.
How the score works
Answers fall into three groups. A 9 or a 10 is a promoter. A 7 or an 8 is a passive. Anything from 0 to 6 is a detractor. The score is the percentage of promoters minus the percentage of detractors, so it runs from -100 to +100. Passives count towards the total but not towards the score.
An example: 200 responses, of which 90 are promoters (45%), 70 are passives (35%) and 40 are detractors (20%). Your NPS is 45 minus 20, which is 25.
Two things follow from the arithmetic. A 7 does nothing for your score, which surprises people who think of 7 out of 10 as decent. And the score moves fastest at the extremes: turning ten detractors into passives lifts it by five points, turning ten passives into promoters does the same. Both are worth doing, but they are different jobs.
Post-purchase NPS
318 responses, last 90 days
NPS
+54
Why email NPS response rates have collapsed
The classic NPS programme is a quarterly email to the customer list. It worked when inboxes were quieter. It is now the channel with the worst response of any way to ask.
Retently analysed 25 million survey invitations sent by 600 ecommerce brands during 2025. In their study, email surveys averaged a 3.24% response rate, in-app surveys averaged 32.34%, and surveys reached through a direct link, where the customer had already chosen to open the page, averaged 97.61%. Broken down by survey type, NPS got 4.5% overall, behind CSAT at 9.76% and CES at 22.54%.
B2B does better because the relationship is closer. CustomerGauge's State of B2B Account Experience report puts the B2B average at 12.4%, with a range from 4.5% to 39.3%, and cites Bain's view that consumer brands should be aiming for 40% and above. Almost nobody reaches that by email.
SurveyMonkey's own 2025 platform data tells the same story from the other side: surveys served through a web link averaged 29.95% and surveys served through their mobile SDK averaged 34.37%. Interruptive popups, the kind that appear on arrival before the visitor has done anything, averaged 3.65%.
The pattern across all three sources is the same. People answer when the question arrives inside the experience, at the moment they have an opinion, and they ignore it when it arrives as a separate task in their inbox a week later. That popup number is the warning: on-site only works when the survey waits for the visitor rather than ambushing them.
Where on the site to ask
The question has to land after the thing you want rated. Three placements cover most businesses.
The account or dashboard page, for software. The customer is logged in, has used the product, and is not in the middle of a task. A small tab in the corner that opens on click, rather than a modal that opens on load, keeps the popup problem away.
The order confirmation page, for ecommerce, for the buying experience. The delivery experience is a separate question that belongs in a follow-up email once the parcel has arrived, and that is one of the few places email still makes sense, because the customer has a reason to open it.
The support ticket close page, or the message that confirms a ticket is resolved. This is the highest-signal moment of all: a detractor here is a customer you were about to lose and can still call.
Two placements to avoid. The homepage, because a first-time visitor has nothing to rate, and the pricing page, because someone comparing plans is a prospect, not a customer, and the feedback you want from them is different. The feedback widget is the right tool for pages like those: it asks how the visit went rather than whether they would recommend you.
Setting it up in Shapo
Shapo's NPS survey is one of three survey modes, next to a five-point feedback survey and an AI-led conversation. Setting one up takes a few minutes.
- Create a survey and pick NPS. The standard question and a comment prompt are filled in. Change the wording, the colours and the language if you like; the 0 to 10 scale and the promoter and detractor labels stay standard so your score is comparable.
- Choose how it appears. A floating button in a corner of your site, with your own text on it, opens the survey in a small panel. An inline embed drops it into a page of its own. A plain link works in emails, receipts and QR codes.
- Paste the snippet. It is the same one-line snippet Shapo widgets use, so if you already show testimonials on your site there is nothing new to install. A visitor who closes the panel with "not now" does not see it again that visit.
- Decide whether to ask why. The comment box under the scale is optional, and so is the AI follow-up, which asks one or two questions about the answer in the customer's language and summarises what it learned. Scores and comments cost nothing to collect; the AI is only involved when you switch it on.
If you would rather send it to a list, an email campaign can target the survey instead of a testimonial form. Each contact gets a personal link and the campaign report counts who responded. The response rate will be lower than on-site, for the reasons above, but it reaches customers who are not visiting the site anymore, which for a churn question is sometimes the point.
How likely are you to recommend us to a friend?
What a good score looks like
Published NPS benchmarks vary so much by industry and by who is measuring that comparing your number to a league table is mostly a way to feel good or bad without learning anything. A software company and an airline should not have the same score, and the same company measured on-site right after a support chat and by email a month later will not have the same score either.
Three comparisons are useful.
- Your own score over time, measured the same way each time. If it moves after a release, a price change or a support policy change, that is the signal.
- Your score by segment. Shapo lets you tag responses, so you can compare the NPS of customers on one product line against another, or a new cohort against an old one. A company-wide 30 that is a 55 on one product and a 5 on another is two different problems.
- Your promoter and detractor counts, not just the net. A score of 20 from 60% promoters and 40% detractors is a polarised business. A score of 20 from 25% promoters and 5% detractors is a business nobody is excited about. They need different work.
What to do with detractors
A detractor with a comment is a to-do item. A detractor without a comment is a statistic, which is why the comment prompt and the follow-up question matter more than the scale. Sort the responses by score, read the 0 to 6 range first, and look for the same complaint appearing in different words. Shapo attaches a sentiment and a short summary to each response, so a hundred comments become a list of topics rather than a reading assignment.
Then close the loop with the ones you can identify. A customer who scored you a 3 and wrote "support never answered" and then hears from a person within a day is a story that gets retold, and it is retold as a positive. The score you measure next quarter is partly the result of what you did with this quarter's detractors.
Responses
All sentiments- 4
Support took five days to answer a billing question.
/account/billingnegative12 min ago - 10
Setup took ten minutes and it just works.
/dashboardpositive1 h ago - 7
Good, but I wish exports were scheduled.
/reportsneutral3 h ago
What to do with promoters
This is the part most NPS programmes skip, and it is where the score turns into something you can show. A 9 or a 10 is the moment to ask for a public review. BrightLocal's 2026 Local Consumer Review Survey of 1,002 US adults found that 97% read reviews for local businesses, that 41% now always read them before choosing, up from 29% a year earlier, and that 49% trust reviews as much as a personal recommendation. Reviews that were posted within the last month mattered to 44% of respondents, so a steady flow beats a big push.
The mechanics are simple once NPS and testimonials live in the same tool. A promoter who leaves a comment can be invited to a collection form, where the comment becomes a testimonial with their name and photo, or sent to your Google Business profile through a review link. The customers who score you highest are the ones whose reviews you want on your site, and now you know who they are the moment they tell you.
Mistakes that make the number useless
Changing the question. "How satisfied are you" is a CSAT question, and a 0 to 10 satisfaction scale is not NPS. Keep the recommendation wording, or the comparisons above stop working.
Asking too often. Once per customer per quarter is plenty. Ask after each interaction and the score becomes a measure of the last interaction, not of the relationship. Put the button on pages customers visit now and then, like the account page, rather than on every page of the site.
Bolting it onto a long survey. Kantar's research on survey drop-off found that a survey over 25 minutes loses more than three times as many respondents as one under five minutes, and that a block of 14 rating statements had a 12% dropout against 2% for a block of 6. NPS works because it is one question. The moment it becomes question one of fifteen, you are back to the email response rates.
Reporting the score without the comments. A dashboard that shows 32 and nothing else tells the team nothing they can act on. Report the score, the trend, and the three most common reasons detractors gave. That is a page a product team can use.